
A few years ago, QR codes felt like a “nice-to-have.” Today, they’re everywhere and the data backs it up. More than 90 million smartphone users scan a QR code every month, and that number keeps climbing as mobile payments, menus, and instant access become part of daily life.
I’ve watched this shift happen up close. What started with QR code menus quietly turned into customer engagement, payments, reviews, and even fundraising, all from a simple scan.
But here’s the real question: where is this going next?
In 2026, QR code adoption isn’t just about convenience. It’s about speed, trust, and better customer experiences.
In this guide, I’ll break down 75+ QR code statistics for 2026, what they really mean, and how businesses are actually using them today.
Top 10 General QR Code Trends You Should Know
Let me cut to the chase, QR codes didn’t just pop up, they exploded into everyday life. In 2025, QR codes weren’t just for menus; they were the backbone of mobile engagement, payments, and customer behavior insights.
But before we jump into specific industries, here’s what the big picture looks like — trends you need to know if you’re planning anything with QR codes this year.
Interesting QR Code Trends & Stats
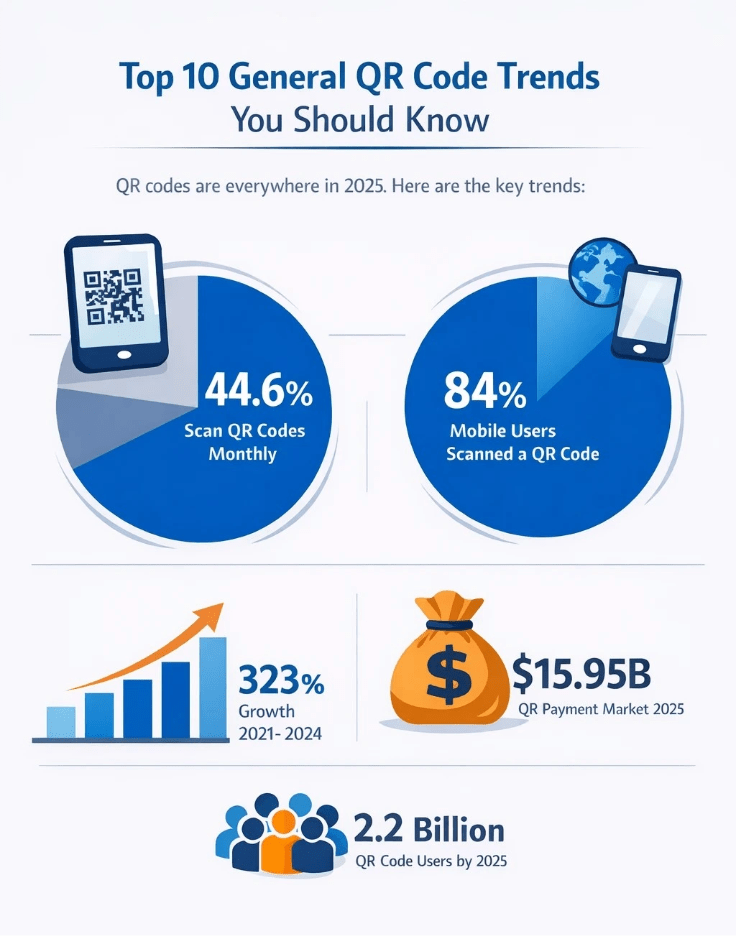
1. Nearly half of global internet users (44.6%) scan at least one QR code every month, showing mainstream adoption.
2. Around 84% of mobile users worldwide have scanned a QR code at least once, proving this isn’t niche tech anymore; it’s a habit.
3. QR code usage surged over 323% between 2021 and 2024, underscoring rapid adoption across contexts.
4. In the United States, the number of smartphone users expected to scan QR codes is projected to reach about 99.5 million in 2025.
5. The global QR code payment market is booming — valued at nearly $15.95B in 2025 and forecast to grow strongly through the decade.
6. 93% of marketers say they’ve increased their QR code usage in the past year, and 88% report positive sentiment from consumers.
7. Almost 80% of businesses have adopted dynamic QR codes, allowing them to track scans and update content on the fly.
8. QR scans in retail and advertising climbed sharply, with households and stores reporting 40% increased engagement via QR triggers.
9. Even as QR codes grow, “quishing” — QR phishing — has become a real concern, surfacing as a major digital scam trend in 2025.
10. More than 2.2 billion people are expected to use QR codes for payments globally by 2025, cementing them as a key payment method.
Global & Regional QR Code Adoption Statistics
Let’s break down adoption the way I see it based on real usage trends and projections.
Worldwide Reach

- Did you know that over 2.9 billion people around the world are expected to use QR codes by 2025? That’s nearly half of humanity engaging with QR code technology in some way.
- A study shows, one big reason for this explosion is that QR codes are no longer tied to a specific app — every modern smartphone can read them natively, which has helped fuel a 30% annual growth in global mobile QR code usage.
Now let’s zoom in by region.
United States
Here in the States, QR adoption really took off after phones started reading them out of the box. In fact, about 99.5 million smartphone users in the U.S. are expected to scan QR codes by 2025, and that number keeps growing.
For perspective, that’s almost like every adult in California, Texas, and Florida having interacted with a QR code at least once.
Even more telling: 84% of all mobile users worldwide (including a huge portion in the U.S.) have scanned a QR code at least once with their phone.
Asia-Pacific
If there’s one part of the world where QR codes have gone far beyond “nice to have,” it’s Asia-Pacific — and India is a huge reason why. In China, QR scanning became second nature years ago thanks to apps like Alipay and WeChat Pay, turning QR payments into an everyday habit used even for street vendors and transit.
But do you know where else this has happened at scale? India’s Unified Payments Interface (UPI) QR network has exploded, growing from hundreds of millions of codes to well over 678 million active UPI QR codes by mid-2025 — and in late 2025, that number crossed 709 million, helping drive billions of contactless transactions.
This isn’t small-time usage either — India’s UPI QR ecosystem more than doubled in about 18 months and now powers a massive share of everyday payments at kirana stores, taxis, grocery shops, and even railway ticket counters.
Asia-Pacific overall continues to lead QR adoption, not just in payment volume but in user familiarity and routine integration, with China, India, Malaysia, and Thailand ranking among the top countries globally for habitual scanning and digital wallet usage.
Europe & UK
Europe’s embrace has been strong and steady. In many Western European countries, QR code scanning isn’t just about paying — it’s about interaction.
Across Europe, adoption is growing year over year, and usage patterns show that smartphones have become handy scanning tools for menus, product info, and mobile vouchers.
While the exact numbers vary by country, the trend line is unmistakable: European smartphone owners are engaging with QR codes more often now than they have in any prior decade.
Africa & Middle East
This region is a bit different — but the upside is enormous.
Mobile penetration and cashless initiatives are rapidly expanding across Africa and the Middle East, and QR codes are often part of that shift because they work even on lower-end devices and don’t require fancy hardware.
While regional scan counts aren’t always published with the same frequency as other regions, growth forecasts point to solid double-digit increases year after year as smartphone access spreads.
Top 10 Countries with the Most QR Code Scans / Usage
(Ranked by the highest proportion of people using QR codes regularly)
- China – 67.4% of the population scans QR codes monthly, leading global adoption.
- Malaysia – 66.1% monthly QR code usage, making it one of the top adopters globally.
- Thailand – 61.5% of people scan QR codes monthly.
- Argentina – 61.0% monthly QR usage.
- Brazil – 60.8% usage, driven partly by PIX payments and contactless adoption.
- Vietnam – 58.3% of the population uses QR codes monthly.
- Switzerland – 57.7% of the population uses QR regularly.
- Taiwan – 57.4% QR usage rate.
- Sweden – 54.9% of people use QR codes monthly.
- Colombia – 54.8% OCR usage among the population.
What does all this add up to?
Here’s the big picture:
- Global QR code usage is growing rapidly year after year, driven largely by smartphone penetration and seamless scanning interfaces.
- Asia leads in sheer volume and payment use, followed by strong movements in North America and Europe.
- Emerging markets in Africa and the Middle East are catching up quickly as mobile and cashless adoption grows.
And here’s a stat that always surprises people: 44.6% of internet users globally had already scanned a QR code at least once by 2023, illustrating that this isn’t just a tech trend, it’s a mainstream behavior.
QR Code Statistics by Consumer Behavior and Demographics
When it comes to who actually scans a QR code, the story is more than “everyone with a phone.” It’s about who uses them most, how often, and what that tells us about consumer habits and yes, it’s more nuanced than you might think.
Age Groups — Who’s Scanning What
- Young adults (18–29) lead the charge. Surveys show this group scans QR codes frequently, especially for menus, offers, and quick info access. In fact, about 54% of US consumers in that bracket clicked a marketing QR code in recent months.
- Adults 30–44 are another big slice of QR users, and in some studies, this group represents the largest proportion of regular scanners, especially in the 33–46 range.
- Adults 45–64 still scan around 44% of them have scanned codes but less often than younger groups.
- Older generations (65+), while slower to start, are not completely absent. In one study, around 31% of consumers aged 65 and older had scanned a QR code in the past three months.
Younger and middle-aged adults scan not just because they can, but because they expect quick access on their phones, which means you should tailor where you place QR codes by the age of your audience.

Gender Trends — Quite Balanced, with Some Nuances
- Usage between men and women is surprisingly balanced overall — surveys show nearly identical scan rates in younger age brackets (e.g., 44.5% of men vs. 44.1% of women aged 16–24).
- In some groups, women slightly outpace men (e.g., ages 25–34), and in older groups, men may scan a bit more (e.g., 55–64).
- Bottom line: gender isn’t a huge barrier to QR adoption — so don’t segment too narrowly unless your audience data says otherwise.
Device Use & Scan Frequency
- Nearly 84% of mobile users worldwide have scanned a QR code at least once with a smartphone.
- Most scanning happens on smartphones, since the built-in camera QR capability removes friction.
- Frequency varies by age: younger groups may scan weekly or more, while older adults might scan monthly or occasionally — but even older consumers are scanning more than they used to, especially when the use case is clear.
QR Code Payments & Market Growth
Let’s unpack where this market stands in 2025 and where it’s headed…
Market Size & Growth Trajectory
- The global QR code payment market was valued at around $14.7 billion in 2024 and is projected to grow to about $38.2 billion by 2030, expanding at roughly 17.2% CAGR over the forecast period.
- Other forecasts project the overall QR code payment ecosystem expanding even more from about $15.95 billion in 2025 to over $73 billion by 2035 at a solid 16.5% CAGR.
- Longer-term estimates suggest the global market could surpass around $61–91 billion by the early-to-mid 2030s, with sustained double-digit growth driven by smartphone and contactless adoption.
The payment side of QR technology is no longer a niche — it’s a fast-growing, multi-billion-dollar mainstream market.
Transaction Value & Consumer Adoption
- Consumers are increasingly using QR codes for payments: forecasts estimate that over 2.2 billion people will use QR code payments globally by 2025, thanks to mobile wallets and contactless infrastructure.
- Total payment volume via QR payments is expected to reach about $3 trillion in 2025, up significantly from prior years as adoption deepens in Asia and beyond.
- Asia-Pacific alone continues to dominate transaction volumes, accounting for over 60% of global QR code payment activity in 2025 — with markets like China and India driving much of that growth.
Regional Nuances in Growth
- Asia-Pacific: Leads by a wide margin, with QR payments deeply embedded in everyday life — for shopping, transportation, and peer-to-peer transfers.
- North America: QR payments are gaining traction quickly, particularly in retail, restaurants, and small business POS setups, as consumers prefer convenient, card-free checkout experiences.
- Europe: Adoption is consistent, especially in urban areas and tourism hubs where contactless payments are standard.
- Emerging Markets: Places like Africa and Latin America are also seeing adoption as smartphones become more accessible.
Source: Coin Law
QR Code Statistics by Industries
Restaurants & Hospitality
- Three-quarters of restaurants worldwide use QR codes for digital menus, ordering, and payments. This has been a lifeline for many during and after the pandemic. Restaurants that added QR menus saw faster table turnover and higher engagement, especially with younger diners who just want to scan and go. According to adoption trends, 78% of diners favor QR codes for convenience when ordering or paying.
- In my own experience working with local cafés, QR codes eliminate the “paper menu shuffle” and help servers focus more on service than handing out menus.
Retail & eCommerce
Retail is arguably one of the most dynamic use cases for QR codes today.
- Nearly 46% of retail marketing now incorporates QR codes on packaging or displays to give shoppers deeper information — everything from ingredients and sustainability claims to style videos and digital offers.
- Brands increasingly use QR codes to link product packaging directly to content that boosts conversion — like how-to videos, reviews, 360° views, and exclusive discounts.
I’ve seen stores go from passive shelf browsing to interactive digital engagement just by placing QR codes next to products — which, believe it or not, encourages in-store dwell time and higher basket size.
Automotive & Logistics
This might surprise some readers, but QR codes started in automotive back in the early days as a parts tracking tool, and they’re still very relevant here.
- Supply chain and inventory management teams now lean on QR codes to track products, parts, and vehicles with minimal error — one study showed 43% of businesses use QR codes for logistics tracking and ~39% for inventory management.
- For customers, dealerships use QR codes to link vehicle details, service history, and owner manuals right to a phone, no CD or USB drive required anymore.
Restaurants & Hospitality
- Three-quarters of restaurants worldwide use QR codes for digital menus, ordering, and payments. This has been a lifeline for many during and after the pandemic. Restaurants that added QR menus saw faster table turnover and higher engagement, especially with younger diners who just want to scan and go. According to adoption trends, 78% of diners favor QR codes for convenience when ordering or paying.
- In my own experience working with local cafés, QR codes eliminate the “paper menu shuffle” and help servers focus more on service than handing out menus.
Retail & eCommerce
Retail is arguably one of the most dynamic use cases for QR codes today.
- Nearly 46% of retail marketing now incorporates QR codes on packaging or displays to give shoppers deeper information, everything from ingredients and sustainability claims to style videos and digital offers.
- Brands increasingly use QR codes to link product packaging directly to content that boosts conversion — like how-to videos, reviews, 360° views, and exclusive discounts.
I’ve seen stores go from passive shelf browsing to interactive digital engagement just by placing QR codes next to products — which, believe it or not, encourages in-store dwell time and higher basket size.
Automotive & Logistics
This might surprise some readers, but QR codes started in automotive back in the early days as a parts tracking tool, and they’re still very relevant here.
- Supply chain and inventory management teams now lean on QR codes to track products, parts, and vehicles with minimal error. One study showed 43% of businesses use QR codes for logistics tracking and 39% for inventory management.
- For customers, dealerships use QR codes to link vehicle details, service history, and owner manuals right to a phone, no CD or USB drive required anymore.
Healthcare & Pharma
Healthcare might sound “too serious” for a QR code, but it’s actually one of the highest-impact use cases I’ve seen.
- Hospitals and clinics are using QR codes for patient wristbands, admission instructions, prescription tracking, and vaccine info, which dramatically reduces errors and streamlines workflows.
- Lab samples tagged with QR codes cut down mislabeling, and telemedicine platforms use QR codes for fast patient access to portals or appointment info.
What I’ve learned from clinics is this: when every second counts, a patient scan is faster than manual search or IDs, and that boosts both safety and satisfaction.
Industry-Wise QR Code Penetration & Usage (2025)
- Retail & eCommerce: 46%
- Restaurants & Hospitality: 75%
- Logistics & Inventory: Around 43% of businesses use QR codes for logistics tracking, and 39% for inventory management
- Product Packaging: 46%
- Marketing & Engagement: 37%
- Dynamic QR Adoption: 79%
Future of QR Codes: 2026 Trends and Stats
Let me share what I’m watching closely: QR codes aren’t just holding their ground — they’re evolving into smarter, more embedded tools across digital and physical experiences.
As we look toward 2025 and beyond, usage isn’t just growing — it’s changing in ways that matter for both consumers and businesses.
Here are the key trends and stats shaping the future of QR codes:
Growth Forecasts & Market Expansion
- The global QR code payment market was valued at approximately $14.7 billion in 2024 and is projected to grow to $38.2 billion by 2030, at a strong 17% CAGR, indicating sustained demand for QR payment solutions.
- Another forecast suggests the QR payment market could expand from roughly $15.95 billion in 2025 to about $73.44 billion by 2035, reflecting long-term confidence in the technology’s role in commerce.
- Across all QR uses (beyond payments), the overall QR market is expected to grow robustly, with some analysts projecting market values above $28 billion by 2030.
Adoption & Usage Trends
- QR code usage surged ~323% from 2021 to 2025, underscoring massive global adoption.
- Scans across 50 countries have increased by 57%, and usage is forecast to rise another 22% by 2025, showing consistent year-over-year growth.
- One powerful signal: over 2.2 billion people are projected to use QR codes for payments by 2025, making it a mainstream payment method for nearly one-third of smartphone users globally.
Dynamic Codes & Personalization
- A major shift isn’t just more QR codes — it’s smarter ones. Around 79% of businesses have adopted dynamic QR codes, which let them update destinations, track usage, and tailor experiences, a real leap from static links.
- Dynamic codes are becoming essential for analytics, A/B testing, and personalized engagements that drive business decisions, not just customer scans.
Multi-Purpose Usage
Expect QR codes to expand beyond payments and menus into:
- Interactive product experiences
- Loyalty and customer profiles
- Augmented reality and AR triggers
- Secure identity and ticketing flow trends are already hinted at in forward-looking analyses of how QR technology is evolving.
Marketing & Consumer Sentiment
- In 2025, 88% of marketers report that consumer sentiment toward QR codes has become more positive, and 93% say they’ve increased QR usage in the past year.
- That tells me this isn’t a fad — brands and audiences both see real value in scans as a bridge from offline to online experiences.
Sustainability & Brand Integration
- QR codes are increasingly seen as a sustainable alternative to printed URLs and paper instructions, reducing waste and offering digital engagement with minimal material cost.
- That ties into bigger consumer trends — eco-friendly brands using QR for transparency and traceability, which I’m observing more frequently in packaging and retail rollouts.
As QR code adoption continues to accelerate across industries and regions, 75+ QR Code Statistics You Must Know in 2026 show that this simple tool has become a powerful bridge between physical and digital worlds.
From payments and customer engagement to smart packaging and loyalty, QR codes are no longer optional — they’re essential. If you’re a business leader, marketer, or local owner, understanding these trends isn’t just useful — it’s strategic. Keep scanning, adapting, and innovating — because QR codes are here to stay.


![8 Best Christmas Marketing Ideas for SMBs to Boost Sales [2025]](https://krofile.com/blog/wp-content/uploads/2025/12/Christmas-Marketing-Ideas.webp)